
How to reduce the turnaround time of servicing jet engines in one of the largest MRO facilities in the world? Proprietary Design Systems, Fleet management, platforms, forecasting, component customization, visualizations, and more!
Designing Scalable Interfaces for Industrial Aviation Applications
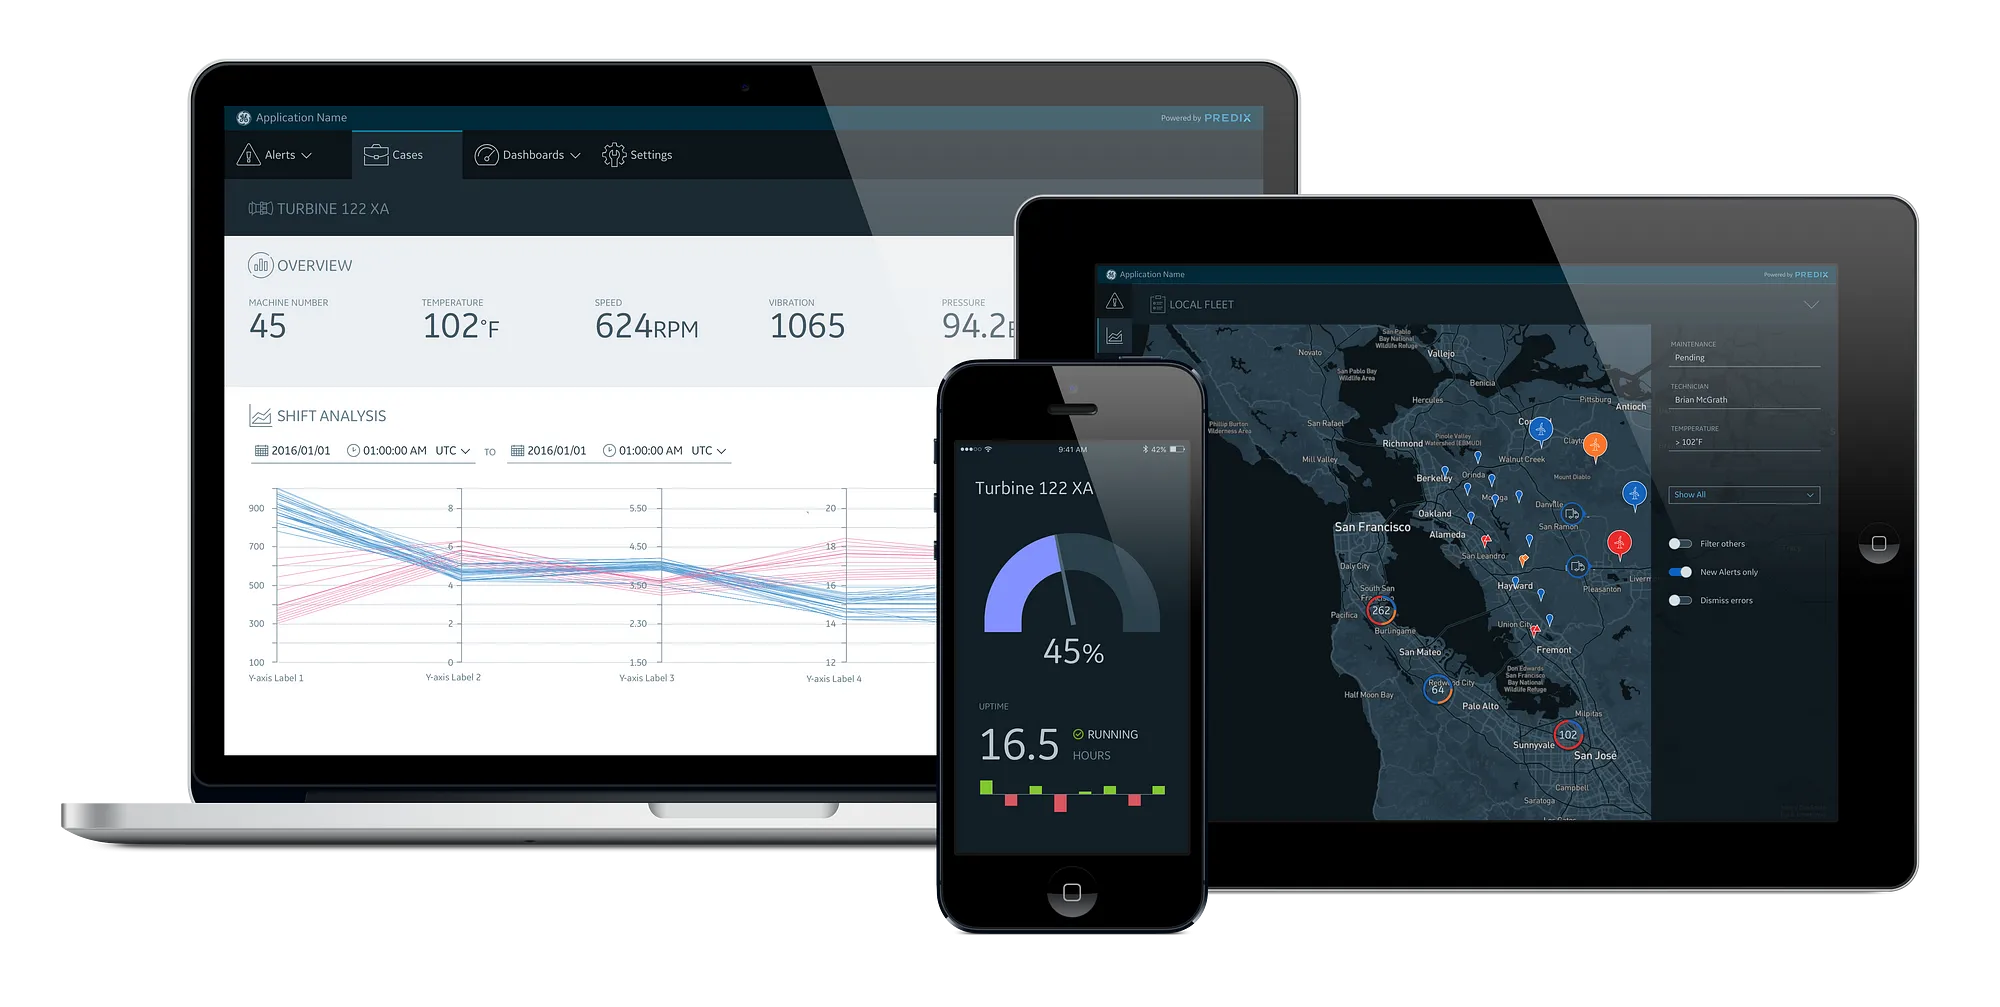
Creating a Modular, Data-Driven UI Web Application to Support Predictive Maintenance
Role: Lead Product / Interaction Designer
Duration: 2019 – 2021
Responsibilities: UI/UX design, interaction design, user research, wireframing, mockups, prototyping, front-end development, design system contributions, and project management.
As a Designer on the R&D team at GE Aviation, I designed and shaped multiple internal products, primarily focused on aviation management. My work involved crafting intuitive interfaces, improving workflows for aerospace professionals, and collaborating closely with engineers and stakeholders. While I can’t share specific details due to privacy restrictions, my contributions enhanced operational efficiency and user experience across critical apps. Below are some brief notes on my work during this time, highlighting publicly available information from one of the projects
Digital MRO ( maintenance, repair and overhaul )
Context
In early 2019, I joined the R&D team with researchers, a product manager, and three software engineers to develop the Digital MRO web application for GE's Research Center. Our goal was to enhance MRO operations for jet engines.
Problem Space
Current MRO processes faced inefficiencies in maintenance planning, unpredictable engine removals, and high downtime due to delayed component replacements, leading to increased costs and reduced service quality.
Solution
We created the Digital MRO web application to forecast engine removals and predict component replacements before overhauls. This included platforms for forecasting, component customization, and visualizations, streamlining operations and decision-making.
Impact
The Digital MRO application improved operational efficiency, reducing turnaround times and operational costs. It provided actionable insights for better maintenance planning and fleet management, enhancing service quality.

Company Background
With a fleet of ~36,000 jet engines, GE Aviation’s services portfolio represents one of the largest growth opportunities for the business. One of the keys to growing this portfolio is implementing new digital solutions to improve their capacity for servicing GE’s jet engines.
GE researchers are helping by integrating new in-situ inspection and materials technologies with fleet and shop operations to optimize Aviation’s maintenance, repair and overhaul (MRO) enterprise.
My Role
I led key design and development efforts, including user flows, wireframes, prototypes (low- and high-fidelity), interaction design, and front-end development. I worked closely with engineers, stakeholders, and end-users to ensure a seamless and intuitive experience.
Using the Design Thinking process (Empathize, Define, Ideate, Prototype, Test), I maintained a user-centered approach throughout development. I designed dynamic, data-driven interfaces with Polymer, D3, JavaScript, CSS, and HTML, ensuring scalability and performance.
To create engaging and accessible experiences, I used Adobe XD for wireframes and prototypes, Illustrator for UI elements, and After Effects/Lottie to develop motion design that enhanced user interactions.
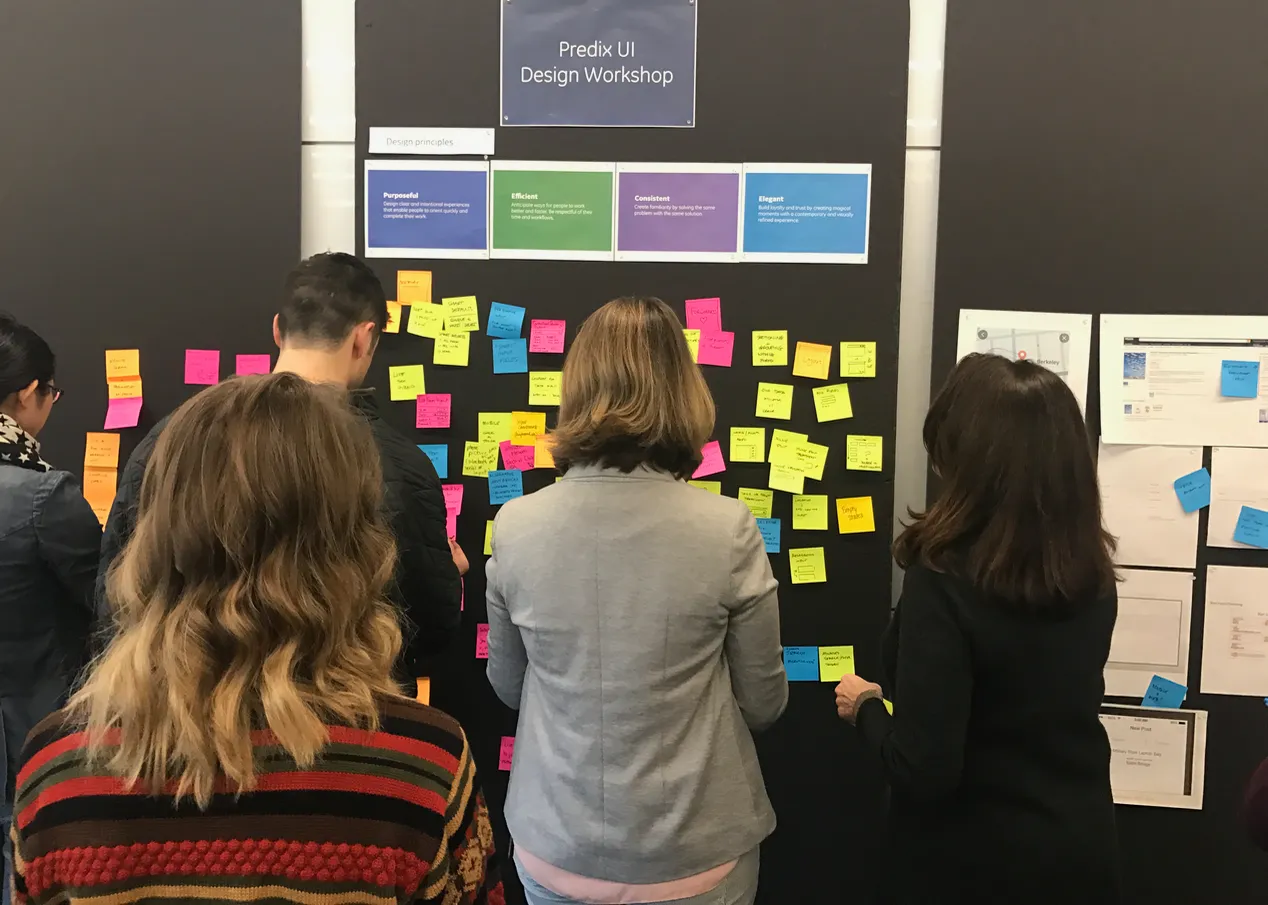
Leveraging the Predix Design System
The project was built on the Predix Platform, GE Digital’s industrial IoT software platform, which enables edge-to-cloud data connectivity, real-time analytics, and scalable services to support industrial applications.
I leveraged the Predix Design System to ensure a cohesive, scalable, and user-friendly experience. This involved applying established design patterns to maintain consistency while also extending components to meet specific industrial use cases. My focus was on optimizing interaction design, improving usability, and ensuring seamless integration across applications.
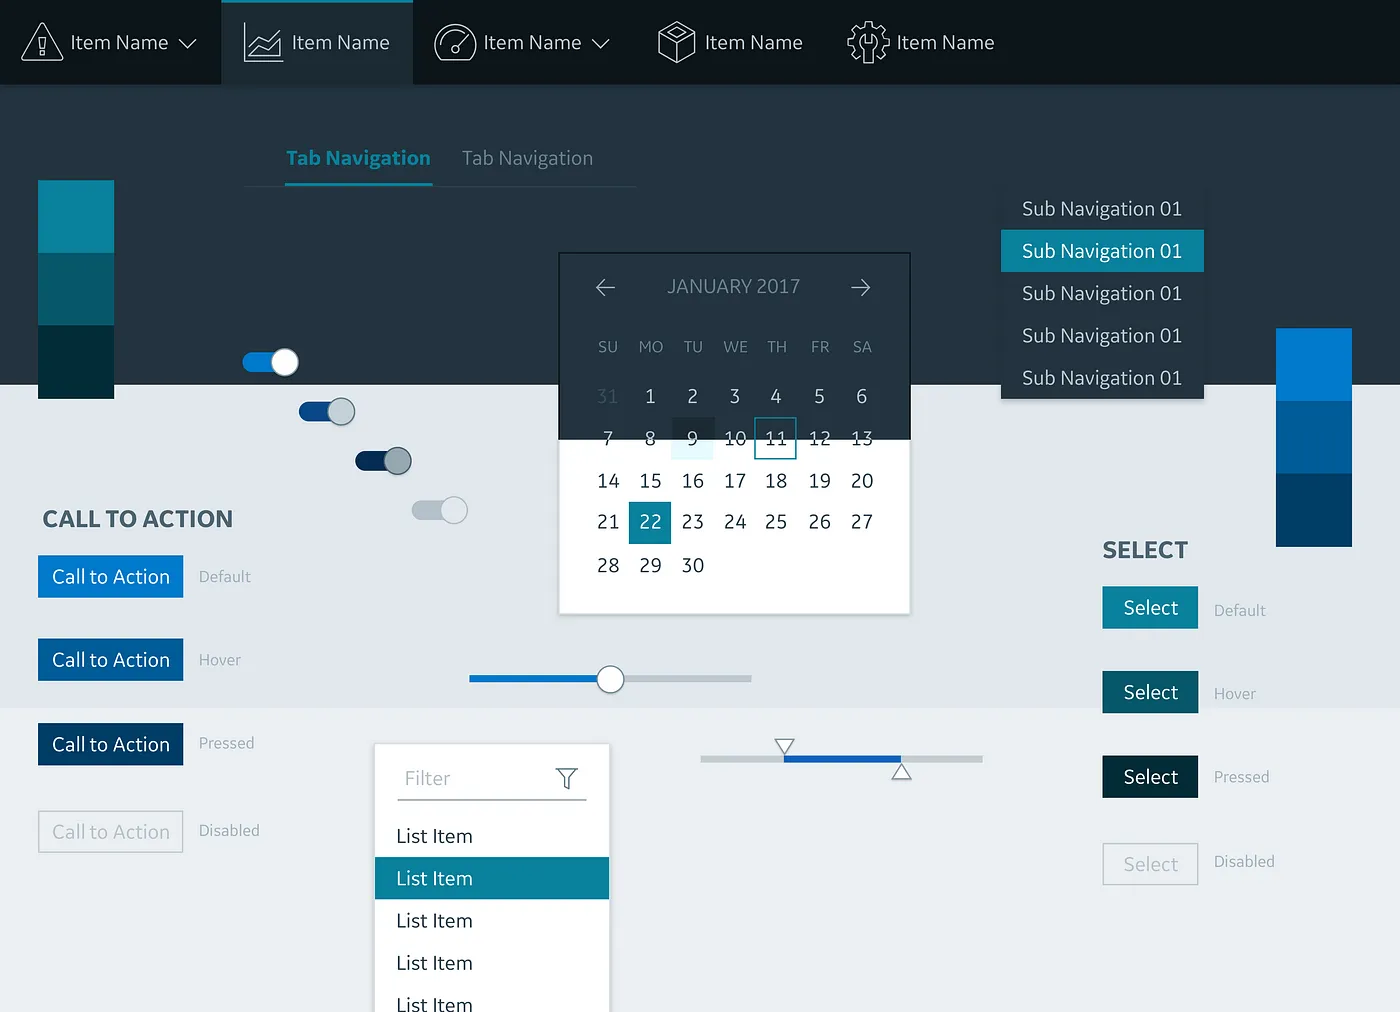
Predix Design System
The Predix Design System provides a common visual and interactive environment for developing Predix-based apps.
It gives a consistent approach to using color, material, typography, page structure, navigation and motion, and comes with a set of tools including templates, design principles, usage guides and stencils.

Predix UI
The Predix UI is distributed as part of the Predix platform and can be used to build user interfaces for industrial Internet web applications.

The system is made up of three parts:
Scalable & Adaptive Design
Using the Atomic Design methodology, I contributed to a modular design system that enabled teams to quickly assemble scalable and adaptable UI screens. Designed for diverse environments and use cases, these components ensured seamless experiences across both regular and low-light settings.
Beyond utilizing these components to build interfaces, I played a key role in expanding their capabilities —enhancing interaction patterns, improving data visualization modules, and optimizing usability. My work focused on making the system more flexible, efficient, and intuitive, ensuring that complex workflows remained user-friendly and accessible.
Interaction Design
As part of the development process, I also implemented the code for these interactions. Below are examples of the navigation bar and layout, demonstrating how the design system was applied and how the interactions were realized in code to ensure a seamless user experience across varying conditions.

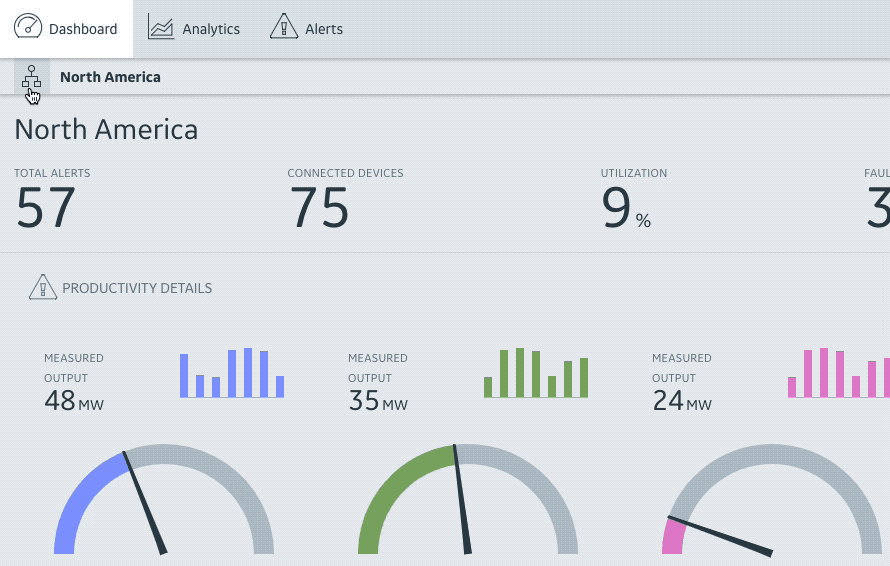
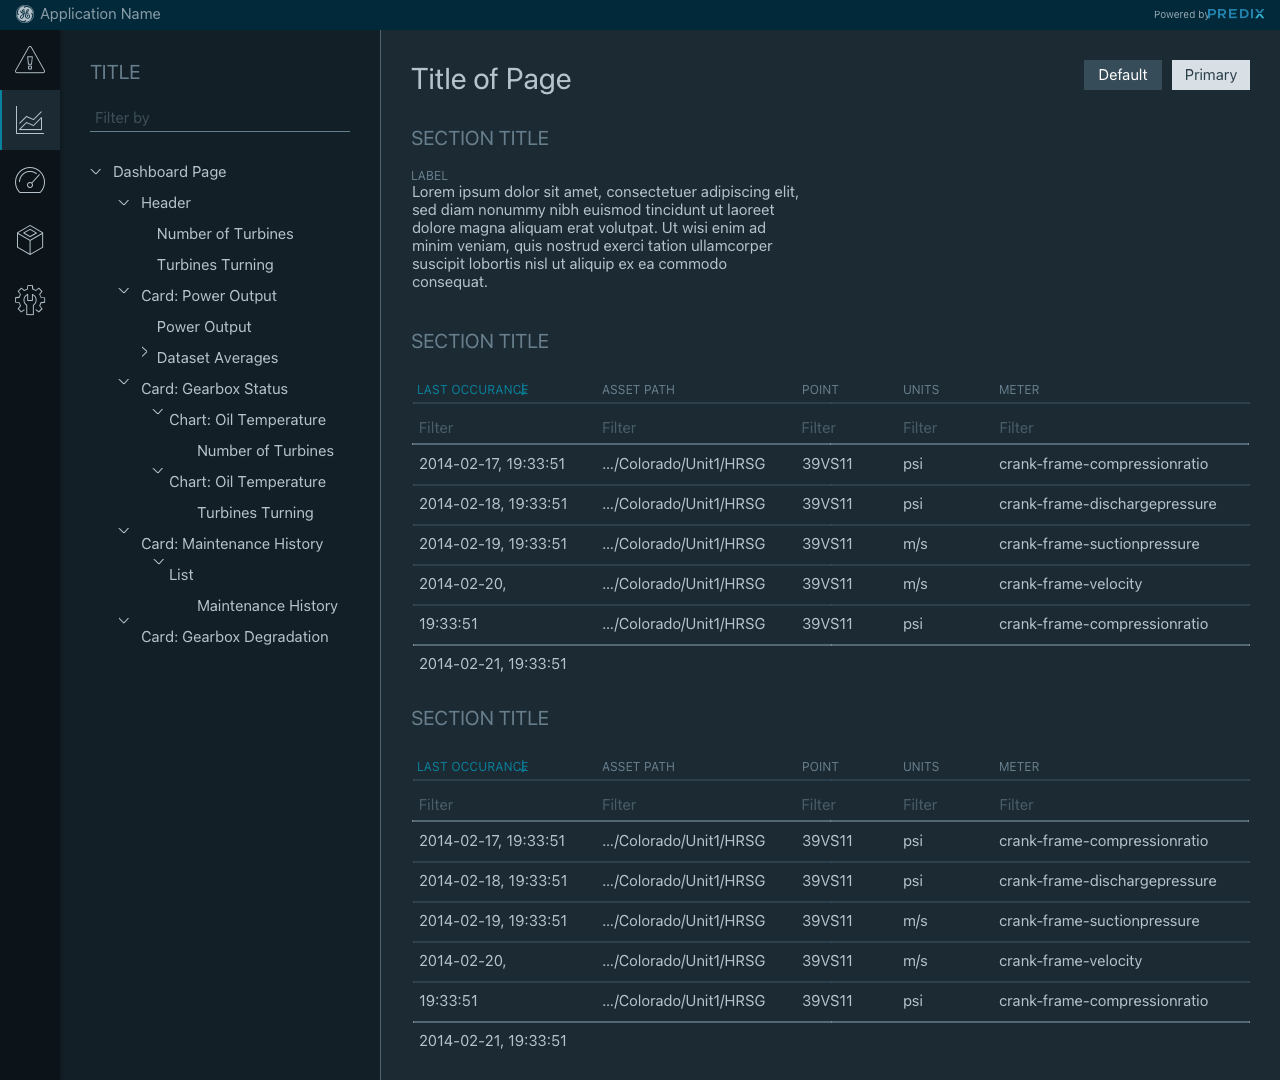
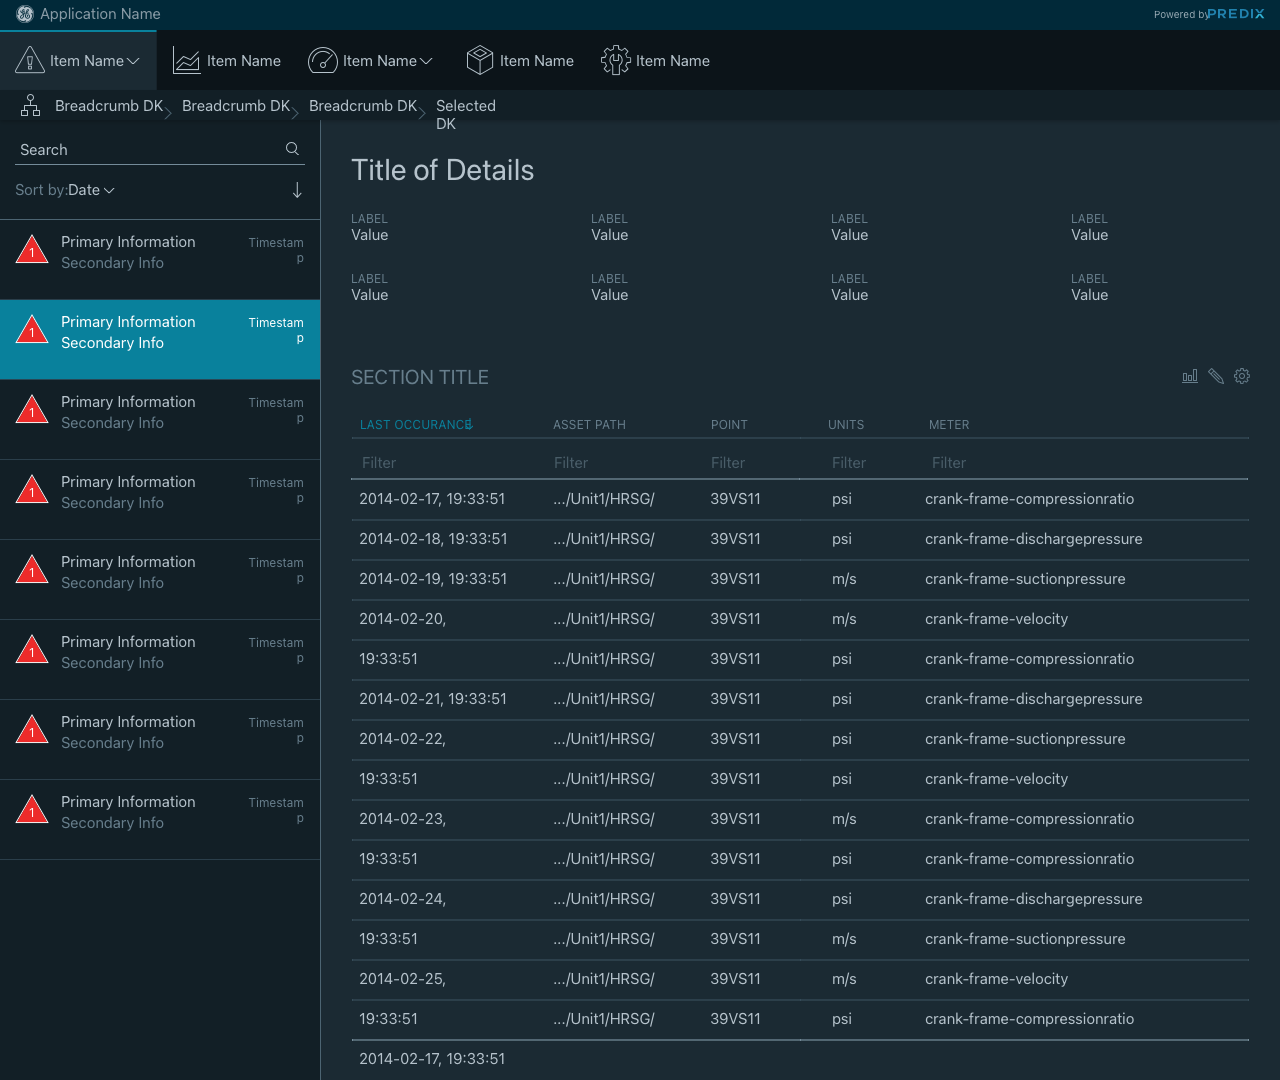
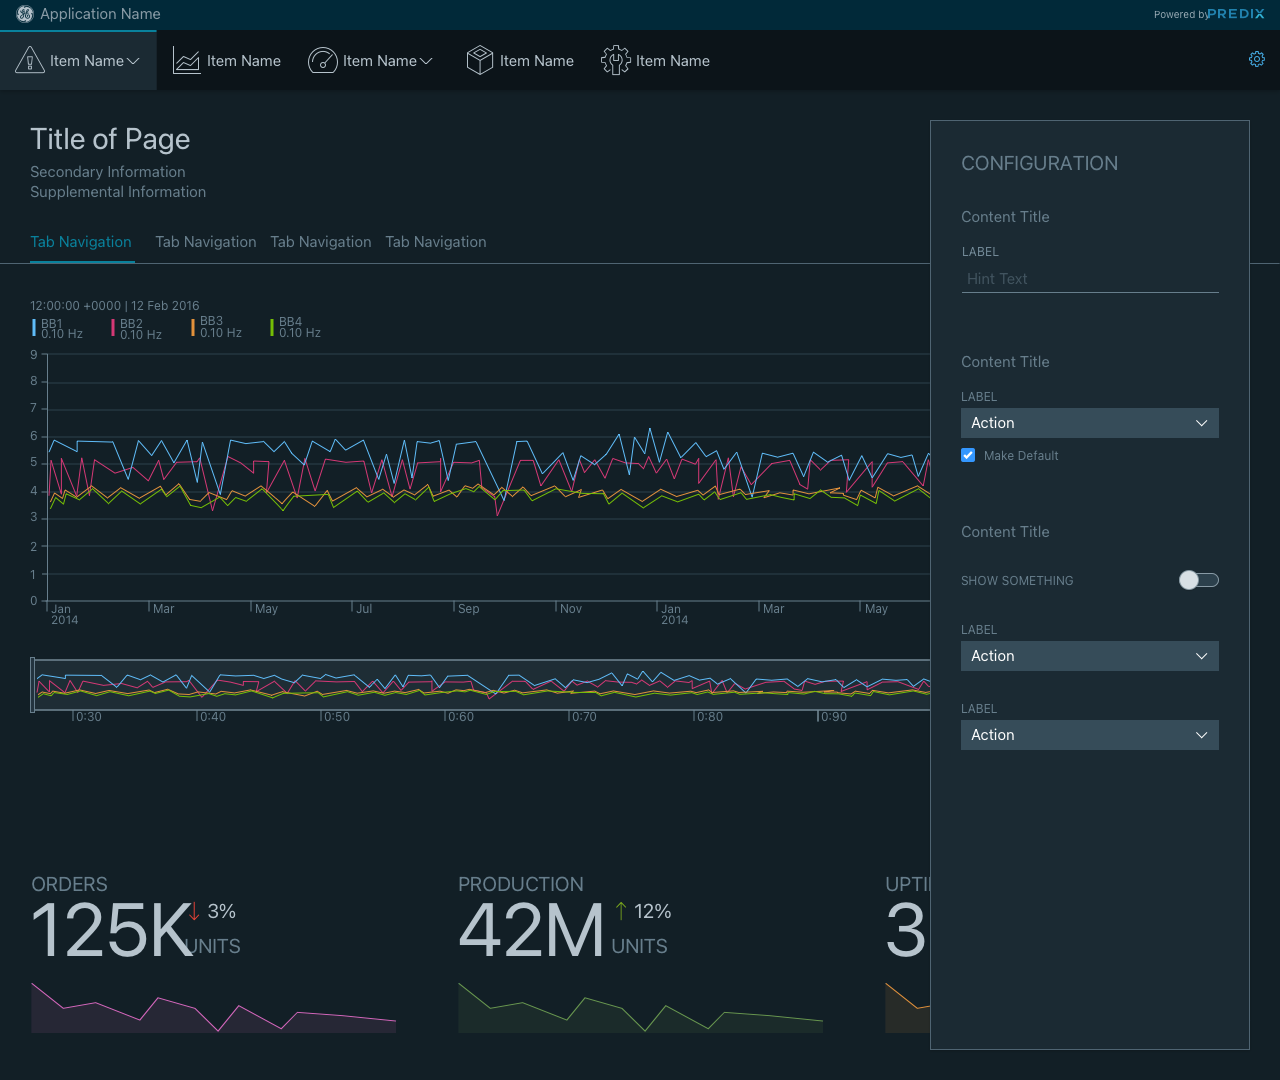
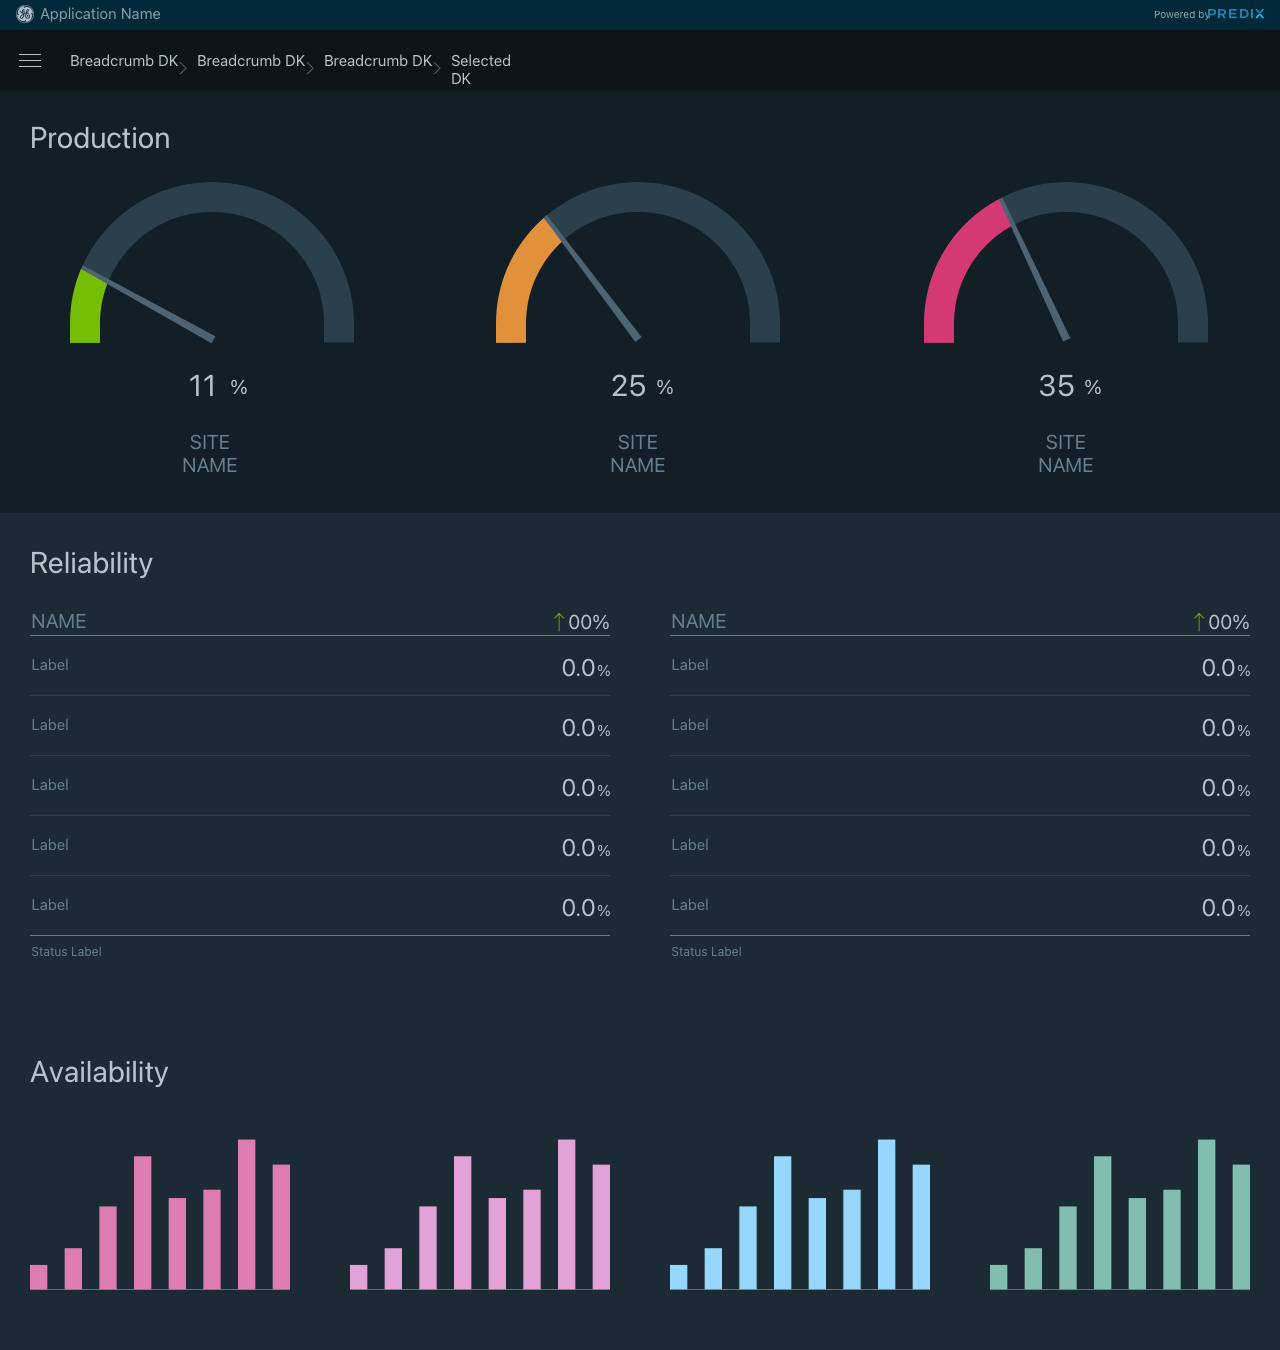
UI/UX
The following examples showcase UI layouts built using the design system’s components, demonstrating how modular building blocks can be assembled to create scalable, complex interfaces. These layouts reflect the structure and functionality of real-world applications I have worked on, adhering to the same design principles and system constraints.
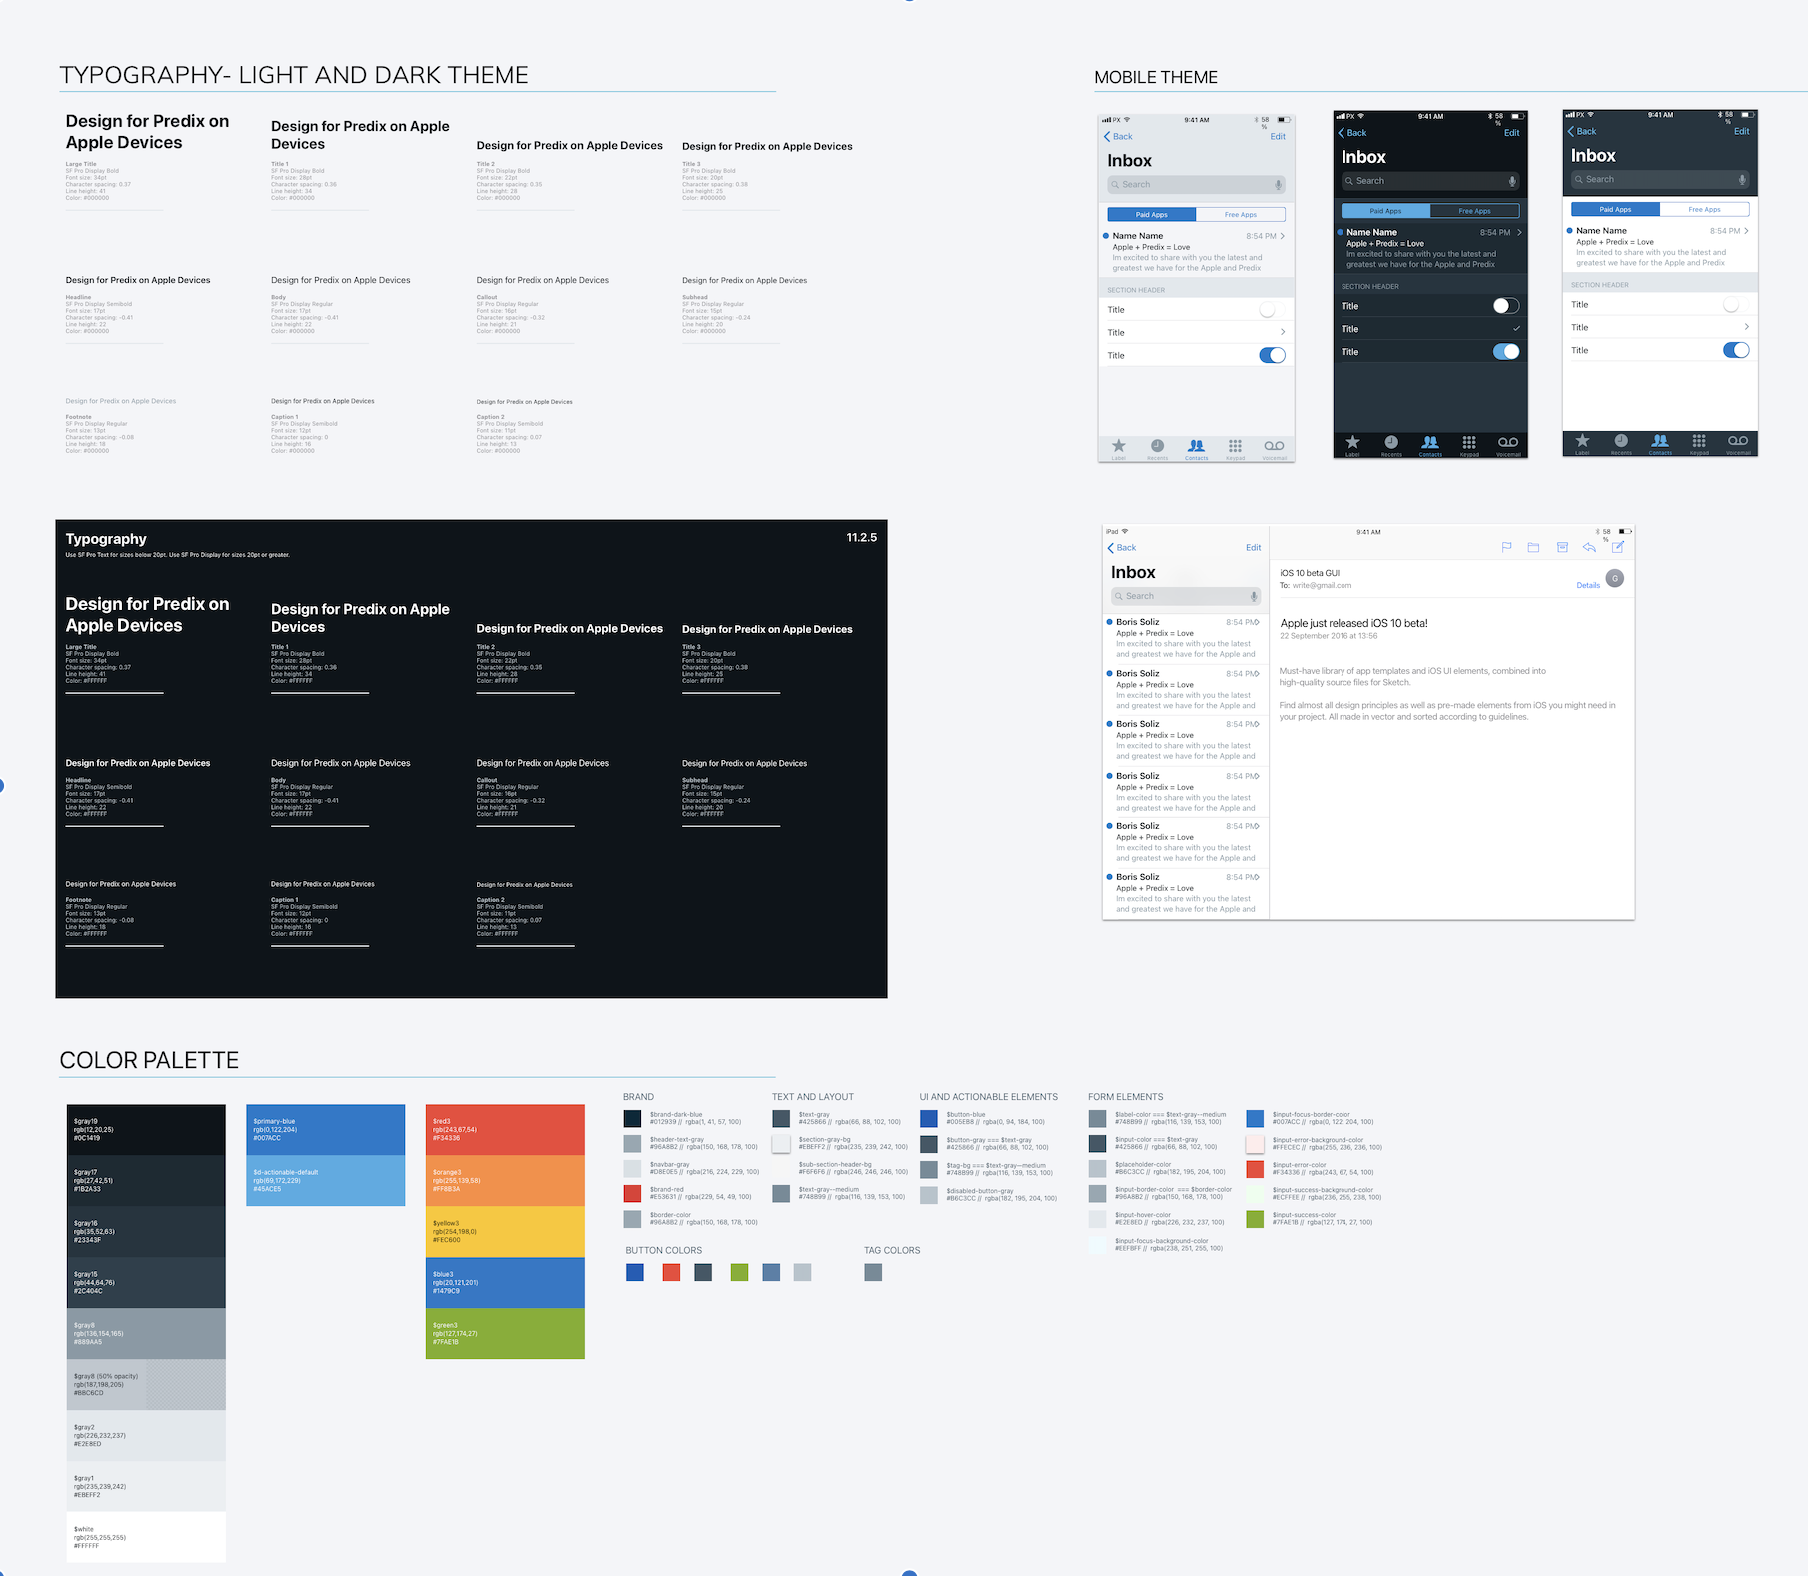
To ensure consistency and adaptability across different platforms, I also contributed to the design language, defining color palettes, typography standards, and mobile-friendly themes. These elements were optimized for usability, accessibility, and performance, enabling seamless experiences across various environments, including dark mode and high-contrast settings.


Data Visualization
The core elements of the system are web components, modular UI building blocks that follow the W3C Web Components standard. These components provide essential user interface elements and more advanced functionalities such as data visualizations, tables, and calendars. They can be combined seamlessly to build complete applications.
In addition to designing basic UI components like dropdown menus, data tables, and tabs, I created a suite of specialized D3-based data visualization components tailored for industrial internet use cases. Specifically, I was responsible for designing and customizing data visualizations for the DMRO project, ensuring they effectively communicated complex data insights.

User Testing
Because our users were based in the UK, we maintained continuous communication to understand their pain points and needs. I also had the opportunity to travel twice to the Wales Aviation Shop, where I conducted on-site testing, gathered user feedback, and gained firsthand insights into the industry and MRO processes.


Due to the proprietary nature of this application I am unable to share any visual designs, but I am happy to further discuss my process.